
IBM just released Cognos Analytics 11.1, which in my opinion raises the bar on self-service, discovery and easy to use analytics. They innovated with the introduction of artificial intelligence (AI), machine learning (ML) and deep exploration in an intuitive, guided interface.
As part of the early adopter program, I explored and will share some of these innovative capabilities.
The Best Cognos Analytics 11.1 Capabilities
1. True AI-driven BI
With the constantly increasing adoption of data science and discovery also came the need to integrate the insights it delivers with an intuitive consumption experience. Many niche vendors provided capability to insert R, Python or other statistical functions into its visualizations but fell short on the interaction with the user. In contrast, thanks to the integration of the Watson Analytics ‘smarts’ (which should be deprecated in mid-2019), Cognos Analytics 11.1 now orchestrates a set of new features intended to empower users with real data exploration. They can augment their visualizations with advanced analytics and deep-dive into their data with the guidance of AI.
This innovation is led by a simple optional ‘Explore’ module, accessed from either the welcome portal or a visualization, and launches a ‘card’ interface. From there, the user is shown a diagram that detects the correlation and strength of each field, as a starting point for the discovery. It even suggests the best starting visualization for displaying such correlation.
Also, each visualization introduces the user to a few common advanced analytics insights, either via:
- ‘Details’, suggests patterns and other detected insights that may not be obvious at first look. Clicking on a suggestion adds a new ‘card’ with a way to look at the data.
- ‘Insights’, adds contextual statistics to the charts. Fields such as average and meaningful differences.
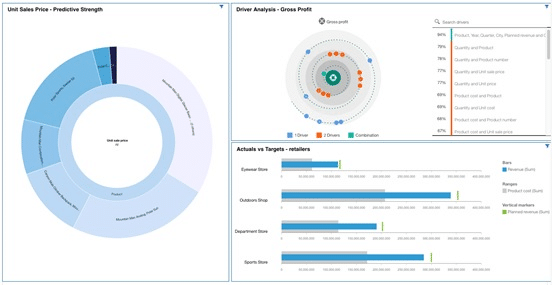
- ‘Badges’, presents contextual target-driver relationships and weight, associated with predictive strength. Including the best supportive way to visualize it, such as decision tree, heat map, correlation, sunburst, or rules list.
- ‘Compare’, bring cards side by side to compare data points, whether they are common or unique.
This concept of cards (also taken from Watson Analytics), is very effective with user engagement in a workflow, or ‘thought process’. Users can always go back to a previous card and further explore, or modify the content as more insights are discovered. Cognos Analytics already had storytelling in its previous version, and the explore ‘deck’ can be easily exported as a story starting point.
2. Enhanced data preparation for analytics
With every ‘data wrangler’ comes the need to prepare the data in order to support a specific use case. However, most of the enterprise reporting platforms have been cautious with this capability as it may conflict with its governance culture.
In its initial release, Cognos Analytics introduced the data module: a web-based, simple modeling interface intended for power users or casual admins to connect, map, and associate data sources. However, some necessary key features were missing. Now they are available in this version and include:
- Data security: modules can implement data level security (currently available for relational data sources only).
- Data Wrangling and cleansing features, such as splitting columns
- Support for uploading multiple excel sheets, split into ‘tables’
- Support for relative time and comparative date handling using lookup to a calendar table (many calendar formats provided)
- Append data sets (note: data sets are an efficient way to support dashboards with a flat, columnar file to ensure interactive performance)
- SQL-based tables and assisted expression editor
- Multi-grain column dependencies (equivalent to determinants in previous generation)
3. Enhanced Dashboarding
Previous releases of Cognos Analytics delivered dashboards using a self-service interface. As a result, it was highly interactive, but a little too simple and limited for some use cases which needed more granularity. Cognos Analytics 11.1 adds many new features to help deliver more flexible and detailed dashboards and effectively leverage real estate.
- Font and value format/control (long awaited)
- Custom palettes to ensure associated categories are displayed in same color
- Advanced analytics and statistical visualizations
- Show data for individual widgets
- The long awaited ‘lasso’ on maps and other correlation charts: allow user to select an area of data points as filter
- AI assistant: innovative feature using natural language. Examples: ‘show me the data available’, or ‘show me the revenue for the product line’. The assistant suggests visualization best suited for the context requested
- Collaboration: IBM has partnered with Slack, a teamwork collaboration platform, that easily integrates across devices and browsers. Once configured, users can share content and comments in direct messaging
4. What about Report Authoring?
Report authoring has always been a strength of the Cognos Analytics platform. In this release, distributing operational reports is enhanced with features to optimize productivity such as:
- Addition of smart layout and grid/snap tools
- Navigation UI for quick access to contractual tools and properties
- Copy / paste any report part into a dashboard
- Reusable styles
- Custom color palettes
- New visualisations, such as river, waterfall, Marimekko and floating charts
Conclusion
Cognos Analytics 11.1 May Now Have the Upper Hand
The competitive market of business intelligence and analytics opened opportunities for both ‘niche’ vendors and enterprise platforms. In addition, the adoption of data science and advanced analytics evolved separately until now. With this promising new generation of Cognos Analytics, it confirms that you can have it ‘both ways’. It innovates by adding guided exploration and suggestive insights to the user experience, all in an integrated and easy to use interface. Certainly this is an efficient way to introduce advanced analytics to the more casual user, while assisting the business analysts in discovering insights and stories about their data.
Share this Article: [DISPLAY_ULTIMATE_SOCIAL_ICONS]